Vision of the Future of Data. Who I am and what I do is influenced by the way I see the world today and how I envision it in the future. My career path, as reflected in my curriculum vitae, is a practical response to both the current state of the world and my outlook on how it’s changing.
The Changing Landscape of Work and Data. Work and data are no longer bound by physical locations and rigid schedules. This shift presents tangible opportunities for us to strategically optimize our use of human and other resources for data analysis and informed decision-making. To achieve this, we’ll need to hone our database design skills, ensuring that we have timely and secure access to the right data in a user-friendly format. Moreover, emerging technologies are making it easier for individuals and teams to access and utilize data in various settings and times, adding depth and relevance to the data’s cultural context.
Adapting to Evolving Data Realities. As data storage and retrieval shift to cloud-based platforms, it’s imperative to cultivate specific skills. We need to learn how to build and access data in the cloud reliably, facilitating effective collaboration across geographical and temporal distances. Leadership qualities become crucial to maintain team focus on organizational objectives while overseeing the integrity of our data systems and user interactions. Furthermore, technical proficiency is essential for collecting, analyzing, and leveraging data in novel ways to address both emerging and pre-defined questions. This entails employing forward-looking techniques that use data to identify and validate predictive models, as well as strategies to pinpoint the most critical outcomes for specific endeavors. Achieving these competencies involves a multifaceted approach, combining elements such as basic research, intricate clinical and analytical models, data mining, algorithms, predictive methodologies, program evaluation, and efficacy models. Emerging technologies will also present fresh opportunities for efficient data collection and utilization, particularly in the realms of research, evaluation, and quality improvement.
My Past Beliefs and Actions. Based on these assumptions, I’ve developed experience and skills that help me effectively use both leadership and technical abilities in various situations. I’m excited about taking on the next challenge that can leverage my unique experiences and skills for long-term growth in both my career and within an organization. This journey aligns with the changing dynamics of work, data usage, and emerging technologies in the world.
Leadership Building.
Leadership Mission. Throughout my career, I’ve held various leadership roles, and I firmly believe that personal and professional relationships are fundamental to sustainability and growth. Additionally, a commitment to continuous improvement guided by data is essential for informed decision-making.
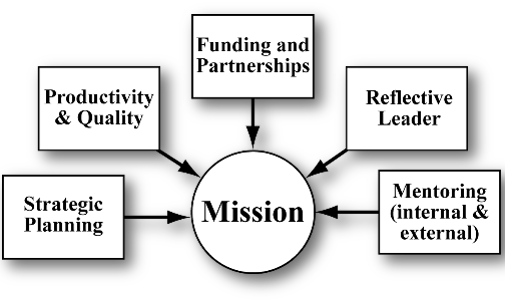
As a leader, my mission is to empower both our team and our systems to achieve sustainable growth in services, funding, staff/faculty satisfaction, and strategic partnerships. To fulfill this mission, I prioritize several key aspects of effective leadership:
-
Strategic Planning : I guide our organization with well-thought-out strategies to chart a clear course forward.
-
Productivity and Quality : I ensure both efficiency and excellence in our operations.
-
Funding and Partnerships: I cultivate financial support and strategic alliances to fuel our growth.
-
Reflection: I encourage a culture of learning from our experiences to adapt and improve.
-
Mentoring: I nurture the potential of our team members, fostering their growth and development.
In essence, my leadership philosophy revolves around nurturing relationships, data-driven decision-making, and an unwavering commitment to growth and excellence.
Productivity And Quality.
My personal service mission is to provide responsive, efficient, and high-quality analytical support. To accomplish this, I regularly collect detailed information about research activities. Analysis of these data typically involve the calculation of indices that are helpful for assessment, for example:
For Research Staff:
-
Proportion of Staff Engaged in Grant Submissions : This index measures the percentage of staff members actively involved in preparing and submitting research grant proposals. For example, if there are 10 staff members, and 7 of them have participated in grant submissions within a given time frame, the proportion would be 70%.
-
Number of Projects per Staff Member : This index quantifies the workload distribution among staff. It reflects the average number of research projects each staff member is currently handling. For instance, if there are 30 projects in total, and 10 staff members, the average would be 3 projects per staff member.
-
Count of Grants, Publications, Presentations, Posters, and Other Forms of Dissemination : This index tallies the actual numbers of grants received, research publications, presentations at conferences, posters, and other dissemination activities completed by each staff member within a specified period.
-
Qualitative Feedback Rating : Staff members can be assessed based on qualitative feedback received from stakeholders, collaborators, and peers. Feedback may include ratings, comments, or evaluations of their teamwork, communication, and problem-solving skills.
-
Proportion of Billable Time per Staff Relative to Their Position : This index measures the percentage of time each staff member spends on billable activities related to their role. For example, if a staff member is expected to spend 70% of their time on billable tasks and they actually spend 75% of their time, this index would be 107%.
For Research Leaders:
-
Strategic Planning Success Rate : Measures the percentage of strategic plans successfully executed under the leadership of research leaders. For example, if a research leader has successfully executed 80% of the strategic plans formulated during their tenure, their strategic planning success rate is 80%.
-
Productivity Enhancement Index : Quantifies the improvement in research productivity achieved under the guidance of the research leader compared to previous periods. It can be calculated by comparing metrics such as the number of publications, grants secured, or projects completed before and after the leader assumed their role.
-
Funding Acquisition Success : Reflects the ability of the research leader to secure research funding and grants for the team. It involves tracking the total amount of research funding obtained under their leadership. For instance, if a research leader secures $2 million in research grants during their tenure, this amount serves as a metric.
-
Feedback from Team Members : Incorporates feedback from team members on leadership effectiveness, team morale, and communication. It can include ratings, comments, or evaluations from team members on aspects such as communication, collaboration, and leadership style.
-
Citation Metrics : Tracks the number of citations of the research leader’s publications, indicating the impact of their research on the academic community. They involve tracking the number of citations their publications receive. For example, if a research leader’s publications collectively receive 1,000 citations, that serves as a metric of their research impact.
-
Collaboration Network Growth : Measures the expansion of the research leader’s collaboration network, highlighting their influence in fostering partnerships. It reflects the increase in the number of collaborative partnerships they have established. For instance, if a research leader initially collaborates with five research groups and later collaborates with ten, this demonstrates growth in their collaboration network.
-
Invited Talks and Keynotes : Counts the number of invitations to deliver talks and keynotes at conferences, demonstrating recognition within the field. It reflects recognition within the field and the demand for their expertise. For example, if a research leader is invited to deliver six talks in a year, this can serve as a metric of their impact.
-
Research Output Increase : This metric assesses the research leader’s contribution to increasing research output within their team or department. It involves tracking metrics such as the number of publications, presentations, or patents generated by the team during their leadership tenure.
-
Innovation Metrics : These metrics measure the extent to which the research leader’s leadership has led to innovative outcomes. For example, the number of new research methodologies, technologies, or products developed under their guidance can be counted.
These indices are calculated at the group-level to evaluate overall group progress and at the individual-level to allow for individual progress assessments in comparison with previous results and with the anonymous results of other staff members. Additionally, triangulating across multiple metrics, rather than relying on select metrics in isolation, is important for several reasons:
-
Comprehensive Evaluation : Triangulation allows for a more comprehensive evaluation of a research leader’s performance and impact. Using multiple metrics provides a holistic view of their contributions, capabilities, and effectiveness.
-
Balanced Assessment : Different metrics capture different aspects of leadership and research impact. By triangulating, organizations can balance the assessment and avoid overemphasizing one aspect while neglecting others. This ensures a fair and balanced evaluation.
-
Reduction of Bias : Relying on a single metric can introduce bias or limitations. Triangulation helps mitigate these biases. For example, a research leader might excel in securing research funding but may not have a high publication rate. By considering both metrics along with others, a more accurate picture emerges.
-
Contextual Understanding : Triangulation helps provide context to the metrics. For instance, a high citation count may be impressive, but it’s even more meaningful when combined with other metrics like collaboration growth or innovative outcomes. It helps answer questions like, “Why are the citations high, and how did the leader achieve this impact?”
-
Identification of Areas for Improvement : Examining multiple metrics allows organizations to identify specific areas where a research leader may excel and areas where they may need improvement. This information is valuable for professional development and targeted support.
-
Risk Mitigation : Relying on a single metric can be risky, as it might not capture all dimensions of leadership effectiveness and research impact. Triangulation helps reduce the risk of making critical decisions based on incomplete or biased information.
-
Robust Decision-Making : Triangulation provides a more robust basis for decision-making. It allows organizations to make informed decisions about promotions, resource allocation, and leadership development with greater confidence.
-
Feedback Loop : Triangulation encourages ongoing evaluation and feedback. Research leaders can receive a well-rounded assessment of their performance, which can inform their goals and strategies for improvement.
-
Transparent Assessment : A triangulated approach to evaluation is often seen as more transparent and fair by stakeholders. It demonstrates that organizations are using a multifaceted approach to assess leadership and impact.
-
Strategic Alignment : Triangulation helps ensure that a research leader’s performance aligns with the organization’s strategic goals and priorities. It allows organizations to assess whether the leader’s contributions are driving the institution in the desired direction.
In summary, triangulating across multiple metrics offers a more comprehensive, balanced, and context-rich assessment of research leadership and impact. It reduces bias, supports informed decision-making, and contributes to continuous improvement and strategic alignment within organizations.
To illustrate this idea, Figure 1 shows the development of scholarly activity based on select group-level indices across three years of leadership. As shown in Figure 1, the team supported 65 grant submissions 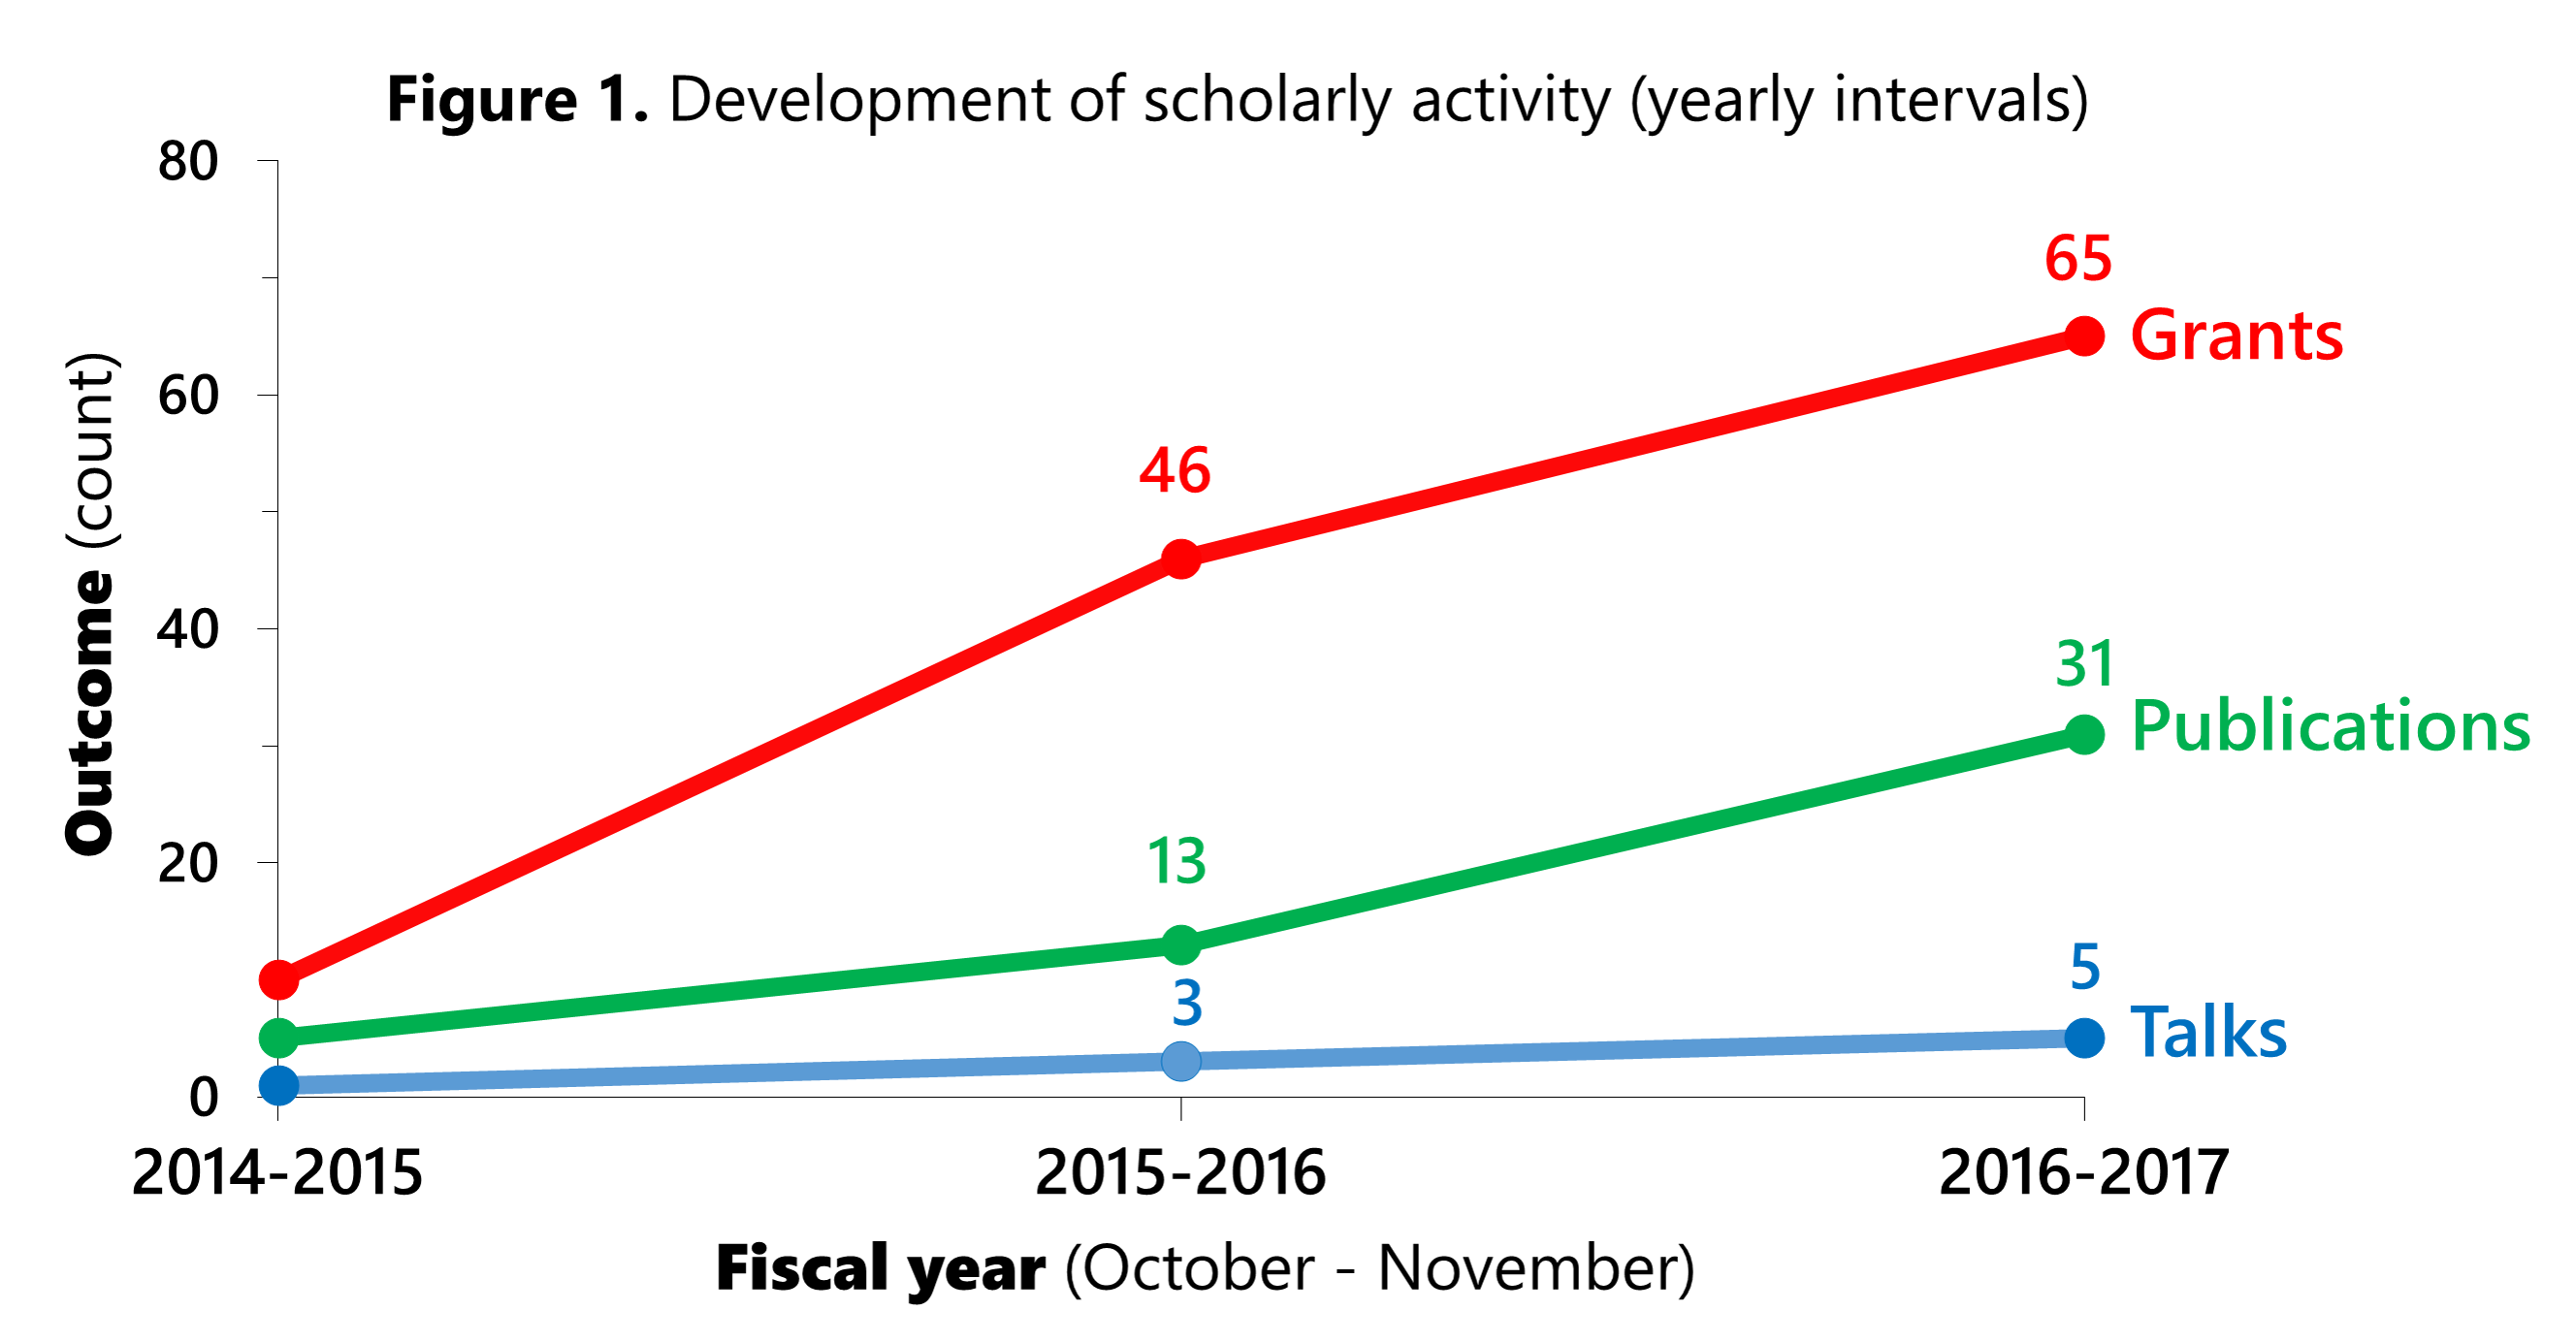 during the final year (Oct. 2016 to Nov. 2017), an increase from 46 the previous year and 10 from my first year with the team (July to October 2015). Pre-award grant work required close resource management to ensure fiscal sustainability. This substantial growth was accomplished in part by increases in efficiency due to experience and focused training, a developing library of grant templates and power analysis code, and increasing demand for this service. Also, we increased the percent of staff involved in grant submisions from 20% in 2014-2015 to 80% in 2016-2017 with 60% of staff included as co-investigators on at least one grant proposal during the last year. Qualitative grant reviews described our grant methodology and analysis sections as: innovative, clear, well-reasoned and appropriate, well thought out, and clearly indicated in the proposal in a highly detailed and concise manner. Similarly the principal investigators summarized our work as: excellent, thoughtful, state-of-the-art, and perhaps the most thorough part of the grant. Published manuscripts also increased with staff co-authorship from 5 in 2014-2015 to 31 publications in 2016-2017 (see Figure 1). Many of these publications were in top tier journals (some with an impact factor > 5). During the last year, team-authored publications were cited a total of 783 times, with a median of 16 citations per staff member. Overall, Figure 1 illustrates the coalescence of a new vision for team leadership within the organization that resulted in new funding, partnerships, and additional value offered by the team.
Technical Skills.
Statistics and quantitative methods. My primary research focus revolves around the creation of innovative statistical methods designed to bridge the gap between the tangible benefits observed in controlled experimental simulations and the more complex and often challenging real-world applications. In these practical scenarios, we encounter a myriad of limitations that demand creative solutions.
One of my central areas of expertise and interest lies in addressing the issue of missing data. I have taken a lead role in conducting simulation-based research to tackle this problem effectively and have made significant contributions to shaping best practices for applied researchers in this domain. Notably, in 2012, my work in advancing multivariate approaches for the measurement and analysis of substantive problems earned me a research grant from the Society for Multivariate Experimental Psychology. This grant emphasized the significance of this research in enhancing our understanding and application of statistical methodologies in real-world contexts, especially when confronted with intricate challenges such as missing data.
-
Howard, W. J., Rhemtulla, M., & Little, T. D. (2015). Using principal component analysis (PCA) to obtain auxiliary variables for missing data in large data sets. Multivariate Behavioral Research, 50(3), 285-299. [Impact Factor 3.691] (PDF, Cite, Source Document)
-
Nicholson, J., Deboeck, P. R., & Howard, W. J. (2017). Attrition in developmental psychology: A review of modern missing data reporting and practices. International Journal of Behavioral Development, 41(1) 143-153. [Impact Factor 1.760] (PDF, Cite, Source Document)
-
Zhou, C., Gao, Y., Howard, W. J. (2017). Evaluation of combining bootstrap with multiple imputation using R on Knights Landing platform. Poster presented at the 4th International Conference on Cyber Security and Cloud Computing, New York, New York. (PDF, link)
Over simplified data analytic practices within the social, behavioral, and health sciences. Within the realms of social, behavioral, and health sciences, there is a common issue of oversimplified data analysis practices that restrict our research vision. We often find ourselves trapped by our approach to data, where we invest substantial intellectual effort in developing intricate theories about how the world functions. These theories represent deep thinking on a subject. However, these well-thought-out theories are frequently fragmented into smaller pieces and forced into standardized statistical procedures that were never intended to address the original research questions adequately.
My dedication lies in recognizing these limiting practices, illustrating their shortcomings with contemporary examples, and presenting viable alternatives to discourage their continued usage. In many cases, we aspire not only to understand if predictive relationships exist but also to delve into how they function and under what conditions they are strong or weak. Moreover, we seek greater flexibility when examining changes over time.
To this end, I have actively collaborated with fellow researchers, successfully securing more than $5 million in new research funding. This collaborative effort has equipped me with extensive experience in applying a diverse array of best-practice methodologies to address complex challenges in emerging areas of research.
-
Okech, D., Howard, W. J., Matthew, R. A., & Purser, G. L. (2020). The effects of sociodemographic variables on the economic behaviour of poorer households in the US and Kenya: a cross-national analyses. Journal of Contemporary African Studies, 1-19. [Impact Factor 0.69] (PDF, Cite, Source Document)
-
Okech, D., Hansen, N., Howard, W. J., Anarfi, J. K., & Burns, A. C. (2018). Social support, dysfunctional coping, and community reintegration as predictors of PTSD among human trafficking survivors. Behavioral Medicine, 44(3), 209-218. [Impact Factor 2.442] (PDF, Cite, Source Document)
-
Desai, A. D., Jacob-Files, E. A., Lowry, S. J., Opel, D. J., Mangione-Smith, R., Britto, M. T., & Howard, W. J. (2018). Development of a Caregivers Reported Experience Measure for Pediatric Hospital-to-Home Transitions. Health Services Research. Behavioral Health Services Research, 53(S1), 3084-3106. [Impact Factor 1.769] (PDF, Cite, Source Document)
-
Malik, F. S., Yi-Frazier, J. P., Taplin, C. E., Roth, C. L., Whitlock, K. B., Howard, W. J., & Pihoker, C. (2018). Improving the Care of Youth with Type 1 Diabetes with a Novel Medical-Legal Community Intervention: The Diabetes Community Care Ambassador Program. The Diabetes Educator, 44(2) 168-177. [Impact Factor 1.736] (PDF, Cite, Source Document)
-
Okech, D., McGarity, S. V., Hansen, N., Burns, A. C., & Howard, W. J. (2018). Financial capability and sociodemographic factors among survivors of human trafficking. Journal of Evidence-Informed Social Work, 15(2), 123-136. (PDF, Cite, Source Document)
-
Stein, E., Howard, W. J., Rowhani-Rahbar, A., Rivara, F. P., Zatzick, D., & McCarty, C. A. (2017). Longitudinal trajectories of post-concussive and depressive symptoms in adolescents with prolonged recovery from concussion. Brain injury, 31(13-14), 1736-1744. [Impact Factor 2.061] (PDF, Cite, Source Document)
-
Simon, T. D., Whitlock K. B., Haaland, W., Wright, D. R., Hood, M., Zhou, C., Neff, J., Howard, W. J., Cartin, B., & Mangione-Smith, R. (2017). Effectiveness of a comprehensive case management service for children with medical complexity. Pediatrics, 140(6) e20171641. [Impact Factor 5.515] (PDF, Cite, Source Document)
-
Law, E. F., Fisher, E., Howard, W. J., Levy, R., Ritterband, L., & Palermo, T. M. (2017). Longitudinal change in parent and child functioning after internet-delivered cognitive-behavioral therapy for chronic pain. PAIN, 158(10), 1992-2000. [Impact Factor 5.559] (PDF, Cite, Source Document)
-
Chan, C. S., Rhodes, J. E., Howard, W. J., Lowe, S. R., Schwartz, S. E., & Herrera, C. (2013). Pathways of influence in school-based mentoring: The mediating role of parent and teacher relationships. Journal of School Psychology, 51(1), 129-142. [Impact Factor 2.299] (PDF, Cite, Source Document)
-
Greenwood, C. R., Buzhardt, J., Walker, D., McCune, L., & Howard, W. J. (2013). Advancing the construct validity of the Early Communication Indicator (ECI) for infants and toddlers: Equivalence of growth trajectories across two early head start samples. Early Childhood Research Quarterly. 28(4), 743-758. [Impact Factor 2.364] (PDF, Cite, Source Document)
-
Greenwood, C. R., Walker, D., Buzhardt, J., Howard, W. J., McCune, L., & Anderson, R. A., (2013). Evidence of a continuum in foundational expressive communication skills. Early Childhood Research Quarterly, 28, 540-554. [Impact Factor 2.364] (PDF, Cite, Source Document)
-
Okech, D., Howard, W. J., Mauldin, T., Mimura, Y., & Kim, J. (2012). The Effects of Economic Pressure on the Resilience and Strengths of Individuals Living in Extreme Poverty. Journal of Poverty, 16(4), 429-446. (PDF, Cite, Source Document)
-
Okech, D., Howard, W. J., & Kim, J. (2012). Efficacy and agency among poor families with and without children. Child & Family Social Work, 17(2) 1-12. (PDF, Cite, Source Document)
-
Buzhardt, J., Greenwood, C. R., Walker, D., Anderson, R., Howard, W. J., & Carta, J. J. (2011). Effects of web-based support on early head start home visitors use of evidence-based intervention decision making and growth in children’s expressive communication. NHSA Dialog: A Research-to-Practice Journal for the Early Childhood Field, 14(3), 121-146. (PDF, Cite, Source Document)
-
Greenwood, C. R., Buzhardt, J., Walker, D., Howard, W. J., & Anderson, R. A. (2011). Program-level influences on the measurement of early communication of infants and toddlers in Early Head Start. Journal of Early Intervention, 33(2), 110-134. [Impact Factor 1.241] (PDF, Cite, Source Document)
-
Howard, W. J., Johnston, H., & Misra, C., (2015, May). Research Computing for Social Scientists. Invited panel at University of Massachusetts, Amherst, MA. (outline, link)
-
Howard, W. J. (2015, February). Planned Missing Data Designs. Invited talk at Department of Statistics, University of Massachusetts, Amherst, MA.
-
Matson, P., Howard, W. J., Chung, S. (2014). Use of P-technique to examine the dynamic relationship among STD-associated feelings and perceptions in a cohort of adolescent females. Poster presented at the 47th Annual Meeting of the Society for Epidemiological Research, Seattle, Washington. (link)
Education
Ph.D., Quantitative Psychology
University of Kansas (2012); Advisor: Todd D. Little
Sample Coursework: Research Design, Factor Analysis, Nonparametric Methods, Test Theory, Multivariate Analysis, Multilevel Modeling, Categorical Data Analysis, Structural Equation Modeling, Longitudinal Structural Equation Modeling, Item Response Theory, Advanced Quantitative Methods, Simulation & Monte Carlo Studies, Dynamical Systems & Intraindividual Change