Creating high-quality path diagrams for structural equation models (SEM) is crucial for clearly communicating your results in academic publications. While some SEM software provide readily available path diagrams, further refinement is often necessary.
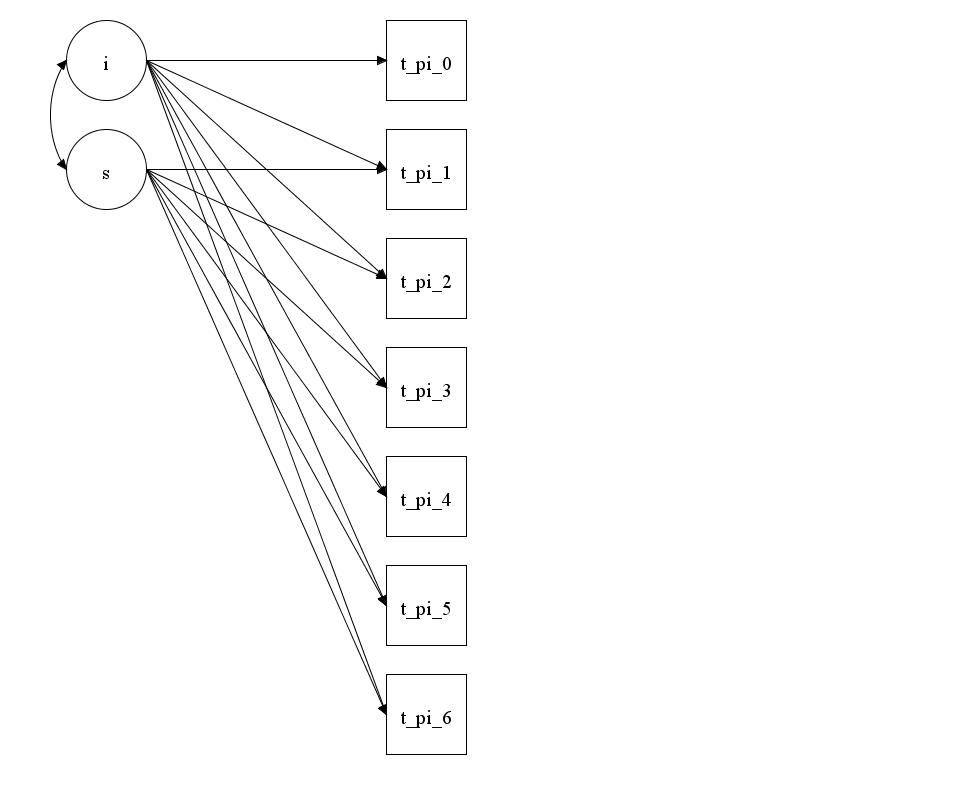
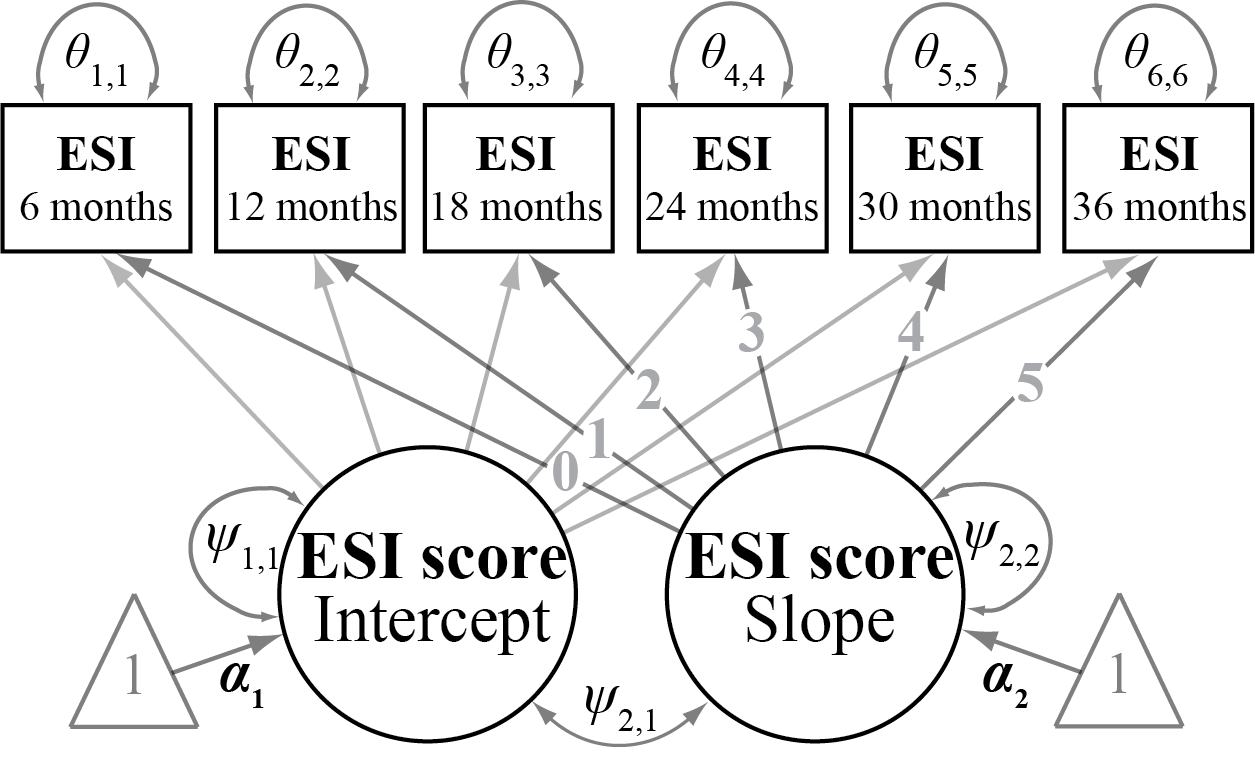
Mplus, for example, provides the Mplus Diagrammer, which can export diagrams in .mdg format, a proprietary binary format, you can’t easily parse or manipulate outside of Mplus. In this guide, we’ll show you how to export your Mplus path diagram (left image) as a .pdf file and refine it in Adobe Illustrator to create a polished, publication-ready professional diagram (right image).


Once you’ve built a library of Illustrator files for different model types, you can bypass the need to use .mdg files altogether.
Sections
Step 1. Generate a template
Before you can refine the diagram, you need to create it in Mplus:
Run your model in Mplus with your desired SEM specifications.
- Use the following command to generate a diagram:
   PLOT:
   TYPE = PLOT3;
This command will generate the path diagram and save it in .mdg format, which contains the structure and layout of your model’s diagram. Now, you need to export it in a format that Adobe Illustrator can work with.
- Alternatively, use the following code to generate a diagram using R:
library(DiagrammeR)
library(DiagrammeRsvg)
library(rsvg)
graph <- DiagrammeR::grViz(" digraph mimic_mode_3 {
graph [overlap = true, fontsize = 10, fontname = Times]
  node [shape = box]
  t_pi_0; t_pi_1; t_pi_2; t_pi_3; t_pi_4; t_pi_5;
  node [shape = circle, fixedsize = true, width = 0.75, label = 'Intercept']
  F1;
  node [shape = circle, fixedsize = true, width = 0.75, label = 'Slope']
  F2;
  edge [color = black]
  F1->{t_pi_0 t_pi_1 t_pi_2 t_pi_3 t_pi_4 t_pi_5}
  F2->{t_pi_0 t_pi_1 t_pi_2 t_pi_3 t_pi_4 t_pi_5}
}")
# Convert DiagrammeR graph to SVG
svg <- export_svg(graph)
# Save the SVG to a file
writeLines(svg, "C://Desktop/lgm.svg")
This code will generate a path diagram and save it in .svg format. While the following example focuses on Mplus, you can also import the .svg file using the same process.
Step 2. Export for Adobe Illustrator
Export the .mdg File to .pdf
Mplus Diagrammer can export diagrams in the .pdf format, which in this case is a vector-based file type that retains scalability, making it perfect for detailed editing in Adobe Illustrator.
-
Open your
.outfile in Mplus. -
Open the Diagrammer and specify the content you want.
-
Go to File -> Save As, and select
.pdf(vector elements in a PDF, such as lines, shapes, and text, are scalable without losing quality).
- This will export the diagram in a high-quality vector format, which can then be imported into Adobe Illustrator for further adjustments.
With the diagram saved as an .pdf file, you’re ready to move on to Illustrator for editing.
Step 3. Import into Adobe Illustrator
Now that you’ve exported your diagram in .pdf format, it can be opened and refined in Adobe Illustrator, which provides powerful vector-editing capabilities.
-
Open Adobe Illustrator and go to File -> Open.
-
Select the
.pdffile you just saved from Mplus Diagrammer.
- When opened, the diagram will be fully editable as a vector file, allowing you to make any adjustments to paths, nodes, and text elements.
Step 4. Refining the Path Diagram
Now that the diagram is open in Adobe Illustrator, it’s time to customize it to make it publication-ready.
1. Ungroup/group the Diagram Elements:
- On import, all components may be grouped together. To edit individual parts, select the diagram and choose Object -> Ungroup. This allows you to manipulate individual nodes, paths, and text elements.
- You may need to repeat this ungrouping process if elements are nested in multiple groups.
- Alternatively, some elements may be ungrouped (e.g., arrowheads) and should be grouped or modified (e.g., adding arrowheads to lines via Illustrator).
2. Edit Text and Labels:
-
Font Style and Size. Select text labels to adjust their font size, style, or color to match your publication’s formatting. Most journals prefer sans-serif fonts like Arial or Helvetica for clarity. Use the Character panel to customize the text.
-
Positioning. Ensure that all labels are properly aligned and not overlapping with paths or nodes. You can drag and reposition text using Illustrator’s selection tool.
3. Customize Paths and Arrows:
-
Line Thickness and Color. Adjust the stroke width of arrows or lines to ensure they are clearly visible. Select any arrow, then modify its properties in the Stroke panel (Window -> Stroke).
-
Arrowheads and Styles. You can adjust the shape and size of arrowheads or switch between solid and dashed lines, depending on the type of relationship being represented (e.g., direct effects vs. covariances). Access these options in the Stroke panel.
-
Color Coding. To enhance visual clarity, consider using different colors to represent various types of paths. This is particularly useful for distinguishing between latent variables, observed variables, and covariances.
4. Refine Shapes (Nodes):
-
Adjust Node Sizes. Click on rectangles (observed variables) or ovals (latent variables) to resize them for better readability. You can also adjust their stroke thickness or fill color to match your figure’s overall design.
-
Fill and Border Colors. Customize the fill color of shapes to group variables visually. Ensure there’s enough contrast between shapes and the background for easy reading.
5. Alignment and Symmetry:
-
Use Illustrator’s Align and Distribute tools (Window -> Align) to ensure that all elements are aligned and evenly spaced. Proper alignment ensures that the diagram looks professional and well-organized.
-
Adjust overlapping arrows or nodes to maintain clarity, especially if multiple relationships are represented in your model.
6. Add or Modify Annotations (Optional):
- You can add additional labels or annotations if necessary to clarify relationships in your model. Use Illustrator’s Text tool to insert any additional notes, and align them with the diagram to ensure a clean, consistent look.
Step 5. Exporting the Final Path Diagram
Once your diagram is fully refined, the final step is to export it in a format suitable for publication. Adobe Illustrator supports a range of high-quality formats that are widely accepted by academic journals.
- Save Your Work in Illustrator Format:
- Before exporting, save your working file in .ai format (File -> Save As -> Adobe Illustrator (.ai)). This allows you to go back and make adjustments if necessary.
- Export for Publication:
- Depending on the journal’s requirements, export the diagram in a vector-based format such as
.eps,.svg,.tiffor.pdf. These formats ensure that the diagram retains its high quality and scalability in the final publication. - Go to File -> Export -> Export As, and choose .eps, .svg, or .pdf from the list of file types.
- Select the resolution (DPI) per journal requirements. Note the best possible image quality will generate a huge file that may be difficult to share.
- Depending on the journal’s requirements, export the diagram in a vector-based format such as